本文译自 StreamNatvie 官方发布的《2022 Pulsar 性能测试报告》
As we move into 2022, the Apache PulsarTM versus Apache KafkaⓇ debate continues. Organizations often make comparisons based on features, capabilities, size of the community, and a number of other metrics of varying importance. This report focuses purely on comparing the technical performance based on benchmark tests.
进入 2022 年,人们对 Apache PulsarTM 与 Apache KafkaⓇ 的争论仍在持续。大家通常会对比二者的特性、能力、社区规模以及其他一系列重要性各异的指标。本报告则侧重于基于基准测试对比二者的技术性能。
The last widely published Pulsar versus Kafka benchmark was performed in 2020, and a lot has happened since then. In 2021, Pulsar ranked as a Top 5 Apache Software Foundation project and surpassed Apache Kafka in monthly active contributors as shown in the chart below. Pulsar also averaged more monthly active contributors than Kafka for most of the past 18 months.
上一次广泛发布的 Pulsar 与 Kafka 基准测试是在 2020 年进行的,而此后发生了很多事情。2021 年,Pulsar 被评为 [Apache 软件基金会 Top 5 活跃提交项目],并在月度活跃贡献者数目上力压 Apache Kafka,如下图所示。在过去 18 个月中,大部分时间 Pulsar 的平均月度活跃贡献者都超越了 Kafka。
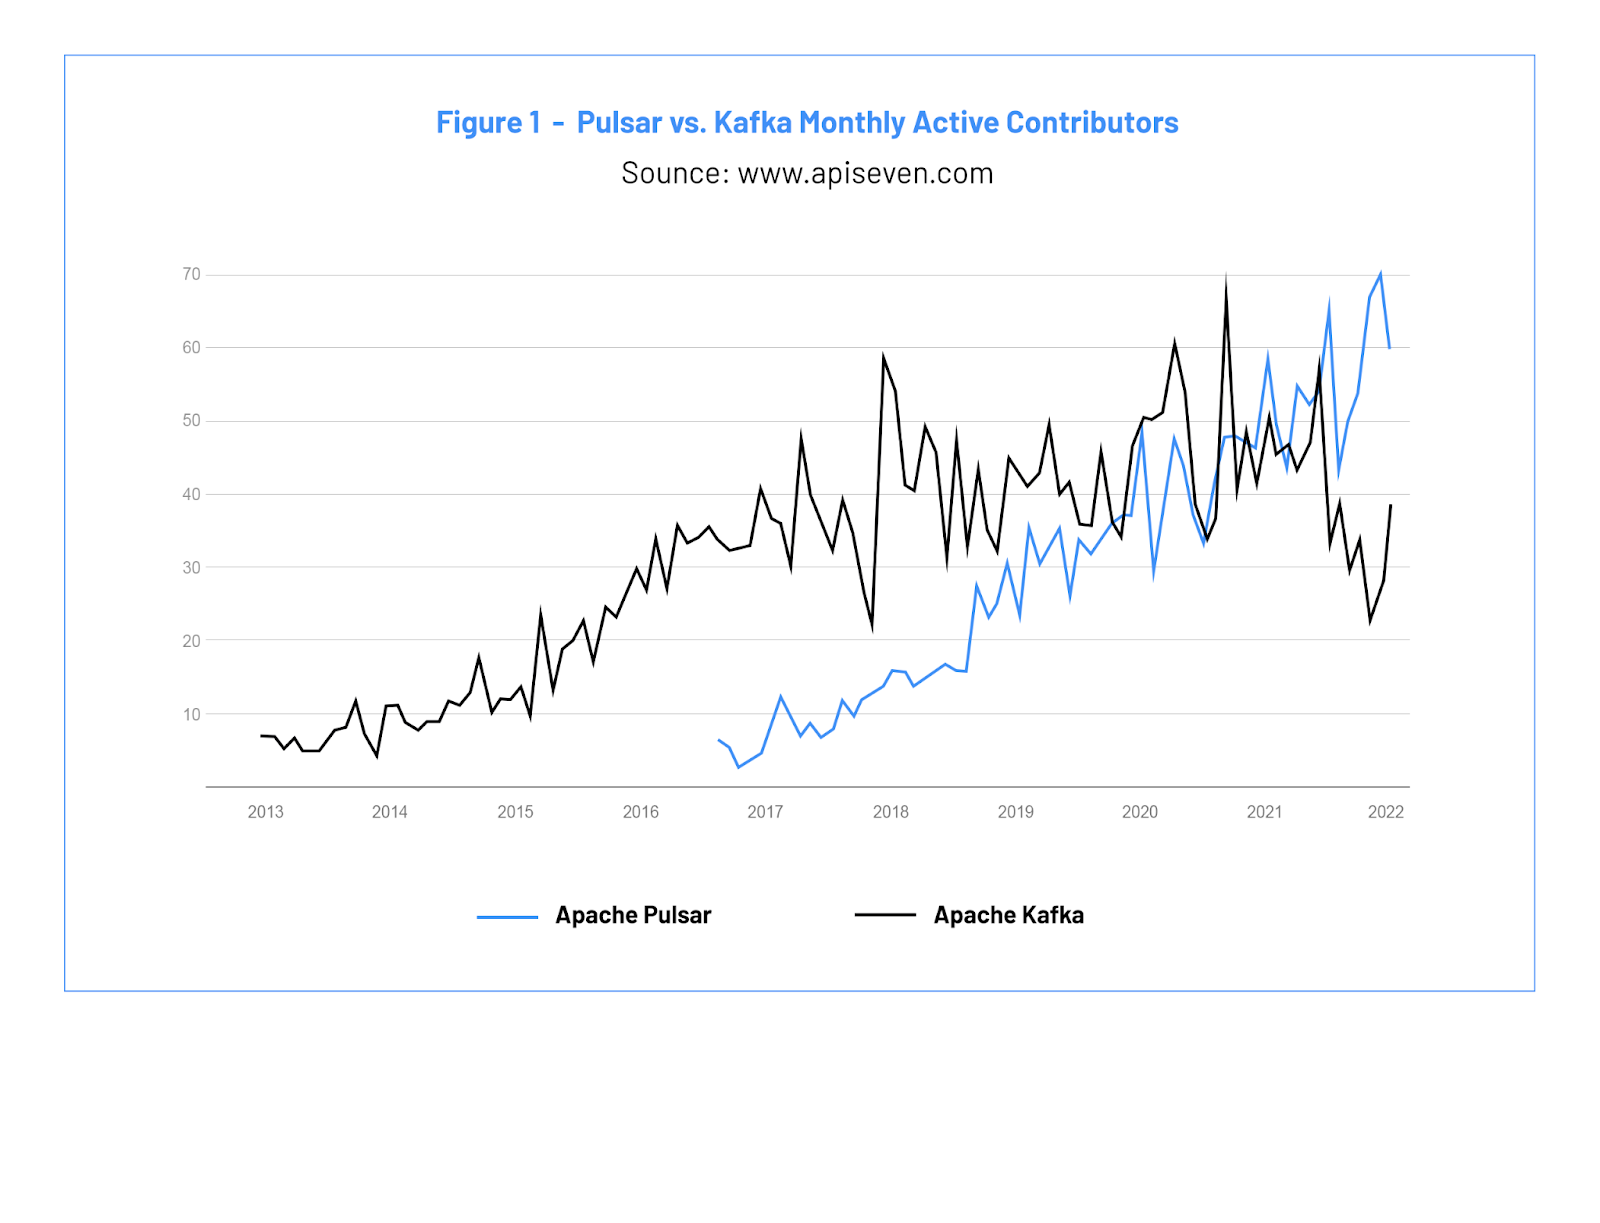
Figure 1: Pulsar vs. Kafka Monthly Active Contributors 图 1:Pulsar 与 Kafka 的月度活跃贡献者对比
These contributions led to major performance improvements for Pulsar. To measure the impact of the improvements, the engineering team at StreamNative, led by Matteo Merli, one of the original creators of Apache Pulsar, Apache Pulsar PMC Chairperson, performed a benchmark study using the Linux Foundation Open Messaging benchmark.
这些贡献为 Pulsar 带来了重大的性能改进。为了衡量这些改进的影响,由 Apache Pulsar 创始人之一、Apache Pulsar PMC 主席 Matteo Merli 领导的 StreamNative 工程师团队使用 Linux Foundation Open Messaging 基准进行了基准测试研究。
The team measured Pulsar performance in terms of throughput and latency, and then performed the same tests on Kafka. We’ve included the testing framework and details below and encourage anyone who is interested in validating the tests to do so.
该团队在吞吐量和延迟方面对 Pulsar 的性能进行了测试,同时对 Kafka 进行了相同的测试。下文中包含了测试框架及相关详细信息,欢迎有兴趣的伙伴验证这些测试。
Let’s take a look at three key findings before jumping into the full results.
在介绍完整的测试结果之前,让我们先看看三个主要发现。
Key Benchmark Findings - 基准测试的主要发现
| 2.5x 比 Kafka 更高的最大吞吐量 |
Pulsar 能够达到 Kafka 2.5 倍的最大吞吐量。这对于导入并处理大量数据的场景来说是一个巨大优势,例如日志分析、网络安全和传感器数据收集。更高的吞吐量意味着只需要更少的硬件,从而降低运营成本。 |
|---|---|
| 100x 比 Kafka 更低的个位数的发布延迟 |
Pulsar 提供稳定的个位数的发布延迟,这比 Kafka 的 P99.99 (ms) 延迟低 100 倍。低发布延迟是很重要的,它使得系统能够快速将消息发布到消息总线。一旦消息发布成功,数据即能安全地进行各种“处理”。 |
| 1.5x 比 Kafka 更快的历史读取速率 |
Pulsar 的历史读取速率比 Kafka 快 1.5 倍,因此使用 Pulsar 作为消息系统的应用可以在意外中断后只需一半的时间即可追上数据。对于数据库迁移/复制这类将数据传输到记录系统的场景来说,读取吞吐量至关重要。 |
Below we provide details on how the benchmark was performed and its results.
下面介绍本次基准测试是如何执行的,以及测试结果相关的详细信息。
Benchmark Tests - 基准测试
Using the Linux Foundation Open Messaging benchmark [1], we ran the latest versions of Apache Pulsar (2.9.1) and Apache Kafka (3.0.0). To ensure an objective baseline comparison, each test in this Benchmark Report compares Kafka to Pulsar in two scenarios: Pulsar with Journaling and Pulsar without Journaling.
我们使用 Linux Foundation Open Messaging 基准 [1],运行(测试期间)最新版本的 Apache Pulsar (2.9.1) 以及 Apache Kafka (3.0.0)。为了确保客观的基线对比,本基准报告中的每个测试都从如下两个设定对比 Kafka 与 Pulsar:启用 Journaling 情况下的 Pulsar,以及禁用 Journaling 情况下的 Pulsar。
Pulsar’s default configuration includes Journaling, which offers a higher durability guarantee than Kafka’s default configuration. Pulsar without Journaling provides the same durability guarantees as the default Kafka configuration, which results in an apples-to-apples comparison.
Pulsar 默认配置是启用 Journaling 的,这提供了比 Kafka 默认配置更高的持久性保证。而禁用 Journaling 的 Pulsar 则提供了与 Kafka 默认配置相同的持久性保证,这使得对比更公平。
I. What We Tested - 我们测试了什么
For this benchmark, we selected a handful of tests to represent common patterns in the messaging and streaming domains and to test the limits of each system:
本次基准测试我们选择了能代表消息领域和流处理领域常见模式的几种测试场景,并测试每个系统的极限:
A. Maximum Sustainable Throughput - 最大可持续吞吐量
This test measures the maximum data throughput the system can deliver when consumers are keeping up with the incoming traffic.
本测试测量当消费者跟上传入流量的情况下系统可提供的最大数据吞吐量。
We ran this test in two scenarios to test the upper boundary performance and to test the cost profile for each system:
我们在如下两个前提设定下执行了该测试,用以测试各个系统的上限性能以及成本概况:
Topic with a single partition. This scenario tests the upper boundary performance for a total-order use case or, in the worst case, where partition keys’ data is skewed. At some scale, the design of a system that relies upon single ordering or handling large amounts of skewed data will need to be reconsidered. Pulsar has the ability to handle situations where total ordering is required at higher scale or large amounts of skew arise. 单分区主题。本设定用于测试全局有序场景的上限性能,或在最坏情况下当分区键数据倾斜时的上限性能。如果系统依赖全局有序或者处理大量倾斜数据,那么在某种程度上其设计需要重新考虑。Pulsar 有能力处理要求全局以更高规模排序、或者存在大量数据倾斜的场景。
Topic with 100 partitions. With more partitions to stress available resources, this test illustrates how well a system scales horizontally (by adding more machines) and its cost effectiveness. For example, by modeling the hardware cost per 1GB/s of traffic, it is easy to derive the cost profile for each system. 100 个分区的主题。更多的分区意味着需要更多的可用资源,本测试说明了系统水平扩展的能力 (通过增加更多机器) 及其成本效益。例如,通过对每 1GB/s 流量的硬件成本进行建模,很容易能得出每个系统的成本概况。
B. Publish Latency at a Fixed Throughput - 固定吞吐量下的发布延迟
For this test, we set a fixed rate for the incoming traffic and measured the publish latency profile. Publish latency begins at the moment when a producer tries to publish a message and ends at the moment when it receives confirmation from the brokers that the message is stored and replicated.
在本测试中,我们设置了固定速率的传入流量并测量发布延迟。发布延迟是指从生产者尝试发布一条消息开始,到它接收到 Broker 确认该消息已被存储并复制为止的时间段。
In many real-world applications, it is required to guarantee a certain latency SLA (service-level agreement). In particular, this is true in cases where the message is published as the result of some user interaction, or when the user is waiting for the confirmation.
在许多现实生产环境的应用中,都要求保证一定的延迟 SLA (服务级别协议)。特别是在当消息发布是由某些用户交互触发的,或者需要用户等待确认的情况下。
C. Catch-up Reads / Backlog Draining - 追赶读(Catch-up Read) / 积压耗尽(Backlog Draining)
One of the primary purposes of a messaging bus is to act as a “buffer” between different applications or systems. When the consumers are not available, or when there are not enough of them, the system accumulates the data.
消息总线的一个主要目的是充当不同应用或系统之间的”缓冲区“。当消费者不可用,或消费者数量不足时,消息系统能够积压数据。
In these situations, the system must be able to let the consumers drain the backlog of accumulated data and catch up with the newly produced data as fast as possible.
在这些情况下,消息系统必须能够让消费者尽快耗尽积压数据,并尽快追赶上新生产的数据。
While this catch-up is happening, it is important that there is no impact on the performance of existing producers (in terms of throughput and latency) on the same topic or in other topics that are present in the cluster.
当发生这种数据追赶时,重要的是不影响同一主题或同一集群其他主题的现有生产者的性能(吞吐量及延迟)。
In all the tests, producers and consumers are always running from a dedicated pool of nodes, and all messages contain a 1KB payload. Additionally, in each test, both Pulsar and Kafka are configured to provide two guaranteed copies of each message.
在所有测试中,生产者和消费者总是在专用的节点池上运行,所有消息都包含 1KB 的负载。此外,在每个测试中,Pulsar 和 Kafka 都配置为为每条消息提供两份副本。
Note: Pulsar also supports message queuing, complex routing, individual and negative acknowledgments, delayed message delivery, and dead-letter-queues (features not available in Kafka). This benchmark does not evaluate these features.
注意:相比 Kafka,Pulsar 还额外支持消息队列、复杂路由、单条确认、否定确认、延迟消息传递和死信队列等 Kafka 中不可用的功能。本次基准测试并不评估这些功能。
II. How We Set up the Tests - 我们如何配置测试
The benchmark uses the Linux Foundation Open Messaging Benchmark suite [1]. You can find all deployments, configurations, and workloads in the Open Messaging Benchmark Github repo [2].
本基准测试使用 Linux Foundation Open Messaging 基准测试套件[1]。您可以在 Open Messaging Benchmark Github 代码库 [2] 中找到所有的部署、配置和负载。
The testbed for the OpenMessaging Benchmark is set up as follows:
OpenMessaging 基准测试平台配置如下:
- 3 Broker VMs of type i3en.6xlarge, with 24-cores, 192GB of memory, 25Gbps guaranteed networking, and two NVMe SSD devices that support up to 1GB/s write throughput on each disk. 3 个 i3en.6xlarge 类型的 Broker 虚拟机,24 核,192GB 内存,25Gbps 网络,两块 NVMe SSD 硬盘,每块磁盘支持最大 1GB/s 的写入吞吐量。
- 4 Client (producers and consumers) VMs of type m5n.8xlarge, with 32-cores and with 25Gbps of guaranteed networking throughput and 128GB of memory to ensure the bottleneck would not be on the client-side. 4 个 m5n.8xlarge 类型的客户端(生产者和消费者)虚拟机,32 核,25Gbps 网络,128GB 内存,以确保客户端没有瓶颈。t2.small 类型的 ZooKeeper 虚拟机。
- ZooKeeper VMs of type t2.small. These are not critical because ZooKeeper is not stressed in any form during the benchmark execution. ZooKeeper 在基准测试执行期间并不会受到任何形式的压力,所以其机器配置并不重要。
We tested two configurations for Pulsar:
我们测试了 Pulsar 的两种配置:
- Pulsar with Journaling (Default):
启用 Journaling (默认):
- Uses a journal for strong durability (this exceeds the durability provided by Kafka). 使用 Journal 可获得强持久性,这超过了 Kafka 提供的持久性。
- Replicates and f-syncs data on disk before acknowledging producers. 在确认响应给生产者之前,对数据进行复制并 f-sync 到磁盘。
- Pulsar without Journaling:
禁用 Journaling:
- Replicates data in memory on multiple nodes, before acknowledging producers, and then flushes to disk in the background. 在确认响应给生产者之前,在多节点内存中复制数据,然后在后台刷新数据到磁盘。
- Provides the same durability guarantees as Kafka. 提供与 Kafka 相同的持久性保证。
- Achieves higher throughput and lower latency when compared to the default Pulsar setup with journaling. 与默认启用 Journaling 相比,能达到更高的吞吐量和更低的延迟。
- Provides a cost-effective alternative to the standard Pulsar setup, at the expense of strong durability. (“Strong durability” means that the data is flushed to disk before an acknowledgement is returned.) 为标准的 Pulsar 配置提供了更具成本效益的替代方案,代价是无法提供强持久性。(”强持久性“意味着数据在返回确认之前被刷新到磁盘。)
We configured Apache Pulsar 2.9.1 to run with the 3/3/2 persistence policy, which writes entries to 3 storage nodes and waits for 2 confirmations. We are deploying 1 broker and 1 bookie for each of the 3 VMs we are using.
我们以 3/3/2 持久化策略运行 Apache Pulsar 2.9.1,将 Entry 写入 3 个存储节点,并等待 2 个节点的确认。我们在 3 个虚拟机上均部署了 1 个 Broker 以及 1 个 Bookie。
We used Apache Kafka 3.0.0 and the configuration recommended by Confluent in its fork of the OpenMessaging benchmark.
我们使用 Apache Kafka 3.0.0 并使用 Confluent 在其 OpenMessaging 基准分支中推荐的配置。
Details on the Kafka configurations include:
Kafka 的详细配置信息如下:
- Uses in-memory replication (using the OS page-cache) but it’s not guaranteed to be on disk when a producer is acknowledged. 使用内存复制(利用操作系统页缓存),但发送确认给生产者时不保证数据已被存储到磁盘。
- Uses the recommended Confluent setup to increase the throughput compared to the defaults:
使用 Confluent 推荐的配置,达到比默认配置更高的吞吐量:
- num.replica.fetchers=8
- message.max.bytes=10485760
- replica.fetch.max.bytes=10485760
- num.network.threads=8
- Uses Producers settings to ensure a minimum replication factor of 2:
配置生产者确保最小复制因子为 2:
- acks=all
- replicationFactor=3
- min.insync.replicas=2
Note: For both Kafka and Pulsar, the clients were configured to use ZGC to get lower GC pause time.
注意:对于 Kafka 和 Pulsar,客户端都配置使用 ZGC 来获得更低的 GC 停顿时间。
III. Benchmark Tests & ResultsIII - 基准测试用例及结果
A. Test #1: Maximum Throughput - 测试 #1: 最大吞吐量
This test measures the maximum “sustainable throughput” reachable on a topic. Eg: The max throughput that is able to push from producers through consumers, without accumulating any backlog.
本测试测量在一个主题上可达到的最大“可持续吞吐量”。亦即在不积压 Backlog 的情况下,能够从生产者推送到消费者的最大吞吐量。
1. Test #1 / Case #1: Maximum Throughput with 1 Partition1 - 测试 #1 / 场景 #1: 单分区的最大吞吐量
This first test uses a topic with a single partition to establish the boundary for ingesting data in a totally ordered way. This is common in all the use case scenarios where a single history of all the events in a precise order is required, such as “change data capture” or event sourcing.
Driver files: pulsar.yaml, kafka-throughput.yaml
Workload file: max-rate-1-topic-1-partition-4p-1c-1kb.yaml
第一个测试用例使用单分区主题,测量以完全有序方式消费数据的吞吐量上限。这个设定在那些要求按精确顺序记录所有事件的单一历史记录的场景中很常见,例如“变更数据捕获”(CDC)或事件溯源等场景。
驱动文件:pulsar.yaml, kafka-throughput.yaml
负载文件:max-rate-1-topic-1-partition-4p-1c-1kb.yaml
a. Case #1 Results: Maximum Throughput with 1 Partition - 场景 #1 结果: 单分区的最大吞吐量
| 禁用 Journaling 情况下的 Apache Pulsar | 启用 Journaling 情况下的 Apache Pulsar (默认) | Apache Kafka | |
|---|---|---|---|
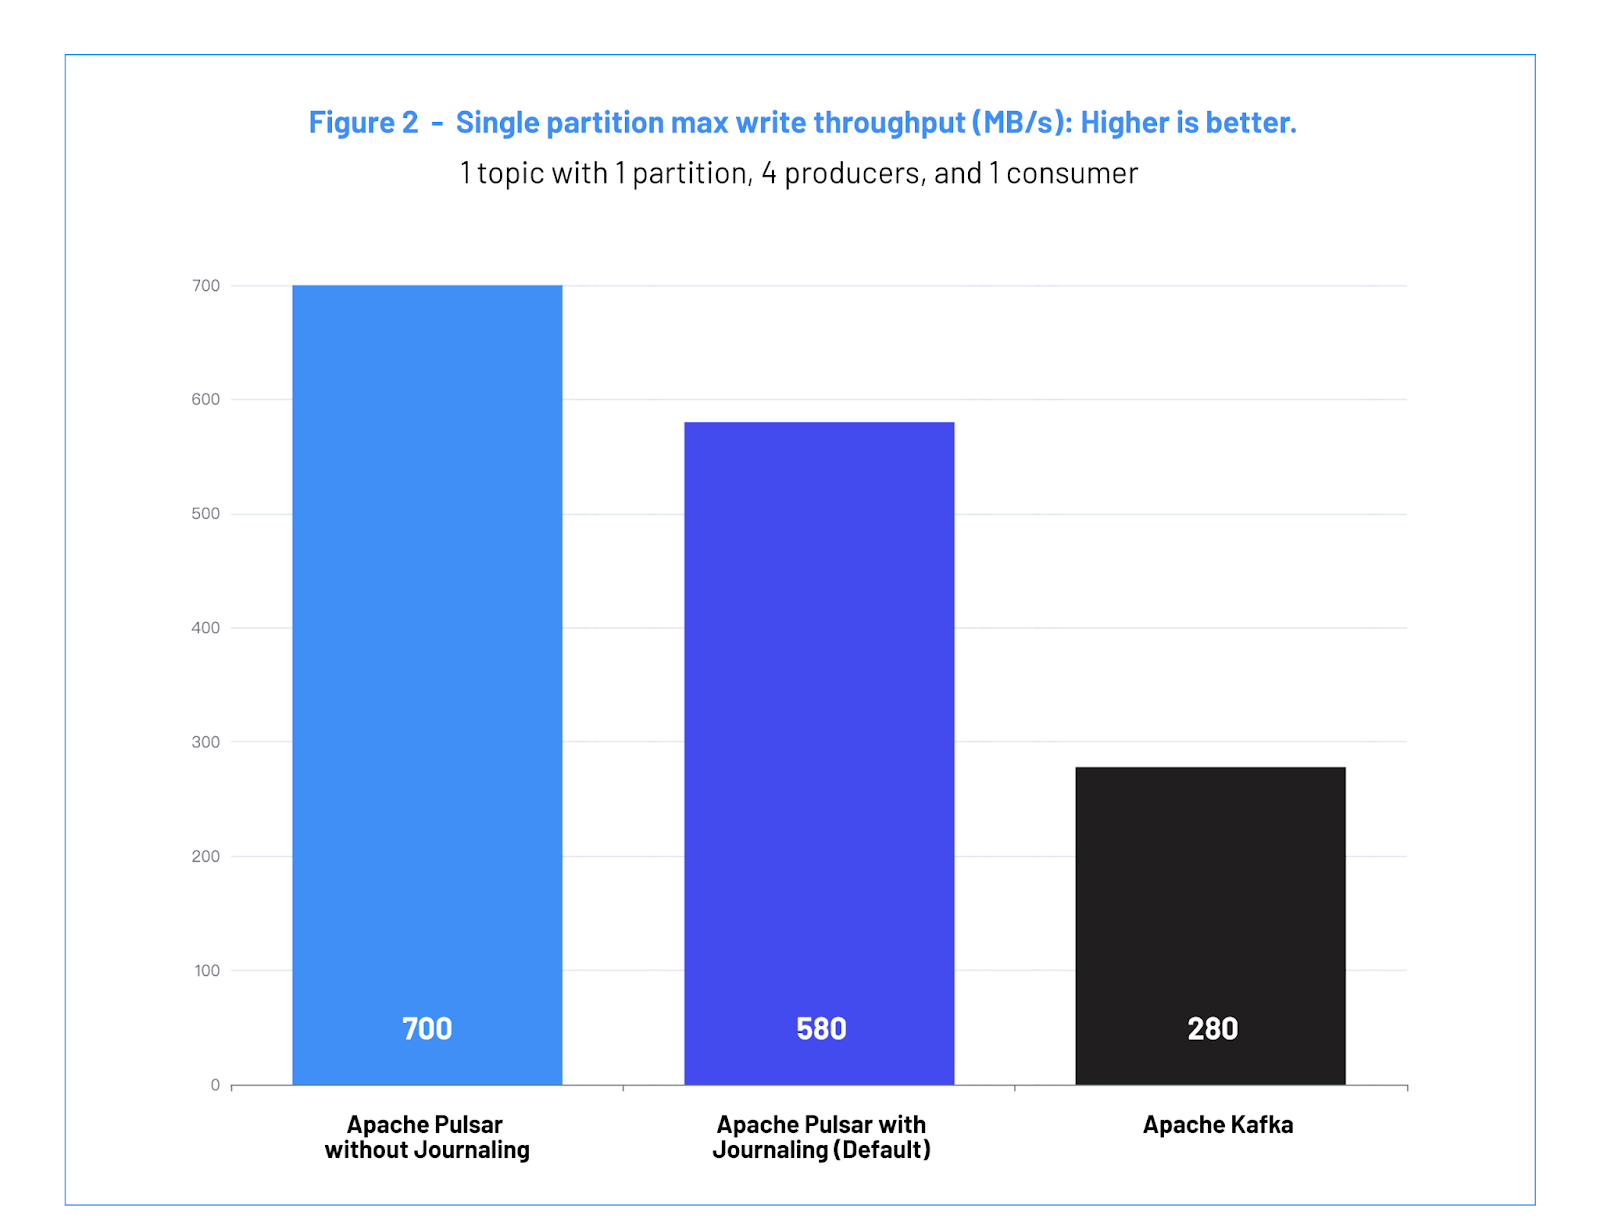
| 吞吐量 (MB/s) | 700 | 580 | 280 |
Figure 2: Single partition max write throughput (MB/s): Higher is better.
图 2:单分区的最大写入吞吐量 (MB/s):数值越高,代表性能越好
b. Case #1 Analysis - 场景 #1 分析
The difference in throughput between Pulsar and Kafka reflects how efficiently each system is able to “pipeline” data across the different components from producers to brokers, and then the data replication protocol of each system.
Pulsar 与 Kafka 之间的吞吐量差异反映了这两个系统如何有效地将数据跨不同组件从生产者 “传输” 到 Broker,也反映了这两个系统数据复制协议的不同。
Pulsar achieves a throughput of 700 MB/s and 580 MB/s, respectively, on the single partitions, compared to Kafka’s 280 MB/s. This is possible because the Pulsar client library combines messages into batches when sending them to the brokers. The brokers then pipeline data to the storage nodes.
Pulsar 在单分区上的吞吐量分别达到了 700 MB/s 和 580 MB/s,而 Kafka 在单分区上的吞吐量为 280 MB/s。这是因为 Pulsar 客户端库在发送消息到 Broker 之前会将多条消息合并成批量消息。然后 Broker 再将数据传输到存储节点。
In Kafka, two factors impose a bottleneck on the maximum achievable throughput: (1) the producer default limit of 5 maximum outstanding batches; and (2) the producer buffer size (batch.size=1048576) recommended by Confluent for high throughput.
在 Kafka 中,有两个因素妨碍了最大可达吞吐量:(1) 生产者默认限制为 5 个最大未完成批次;(2) Confluent 为实现高吞吐量而推荐的生产者缓冲区大小为 (batch.size=1048576) 。
Note: Increasing the batch.size setting has negative effects on the latency. This is not the case for Pulsar producers, where the batching latency is controlled by the batchingMaxDelay() setting, in addition to the batch max size.
注意:在 Kafka 中增加 batch.size 参数会对延迟产生负面影响。而 Pulsar 生产者则不然,其批处理延迟除了受批次最大大小影响,还受 batchingMaxDelay() 控制。
With the increase in single topic throughput, Pulsar provides developers and architects more options in how they build their system. Teams can worry less about finding optimal partition keys and focus instead on mapping their data into streams.
随着单主题吞吐量的增加,Pulsar 为开发人员和架构师提供了更多的构建系统的选择。团队不必操心寻找最佳分区键,而可以专注于将数据映射到流中。
2. Test #1 / Case #2: Maximum Throughput with 100 Partitions - 测试 #1 / 场景 #2: 100 个分区的最大吞吐量
Most use cases that involve a significant amount of real-time data use partitioning to avoid the bottleneck of a single node. Partitioning is a way for messaging systems to divide a single topic into smaller chunks that can be assigned to different brokers.
多数涉及大量实时数据的场景都会使用分区来避免单个节点的瓶颈。分区是消息系统将单个主题拆分为较小块的一种方式,这些块可以分配给不同的 Broker。
Given that we tested on a 3-nodes cluster, we used 100 partitions to maximize the throughput of the system across the nodes. There is no advantage to using a higher number of partitions on this cluster because the partitions are handled independently and spread uniformly across the available brokers.
鉴于我们在一个 3 节点集群上做测试,我们使用 100 个分区来最大化系统跨节点的吞吐量。在这个集群上使用更多的分区并没有任何好处,因为分区是独立处理的,并在可用 Broker 中均匀分布。
驱动文件:pulsar.yaml, kafka-throughput.yaml
负载文件:1-topic-100-partitions-1kb-4p-4c-2000k.yaml
a. Case #2 Results: Maximum Throughput with 100 Partitions - 场景 #2 结果: 100 个分区的最大吞吐量
| 禁用 Journaling 情况下的 Apache Pulsar | 启用 Journaling 情况下的 Apache Pulsar (默认) | Apache Kafka | |
|---|---|---|---|
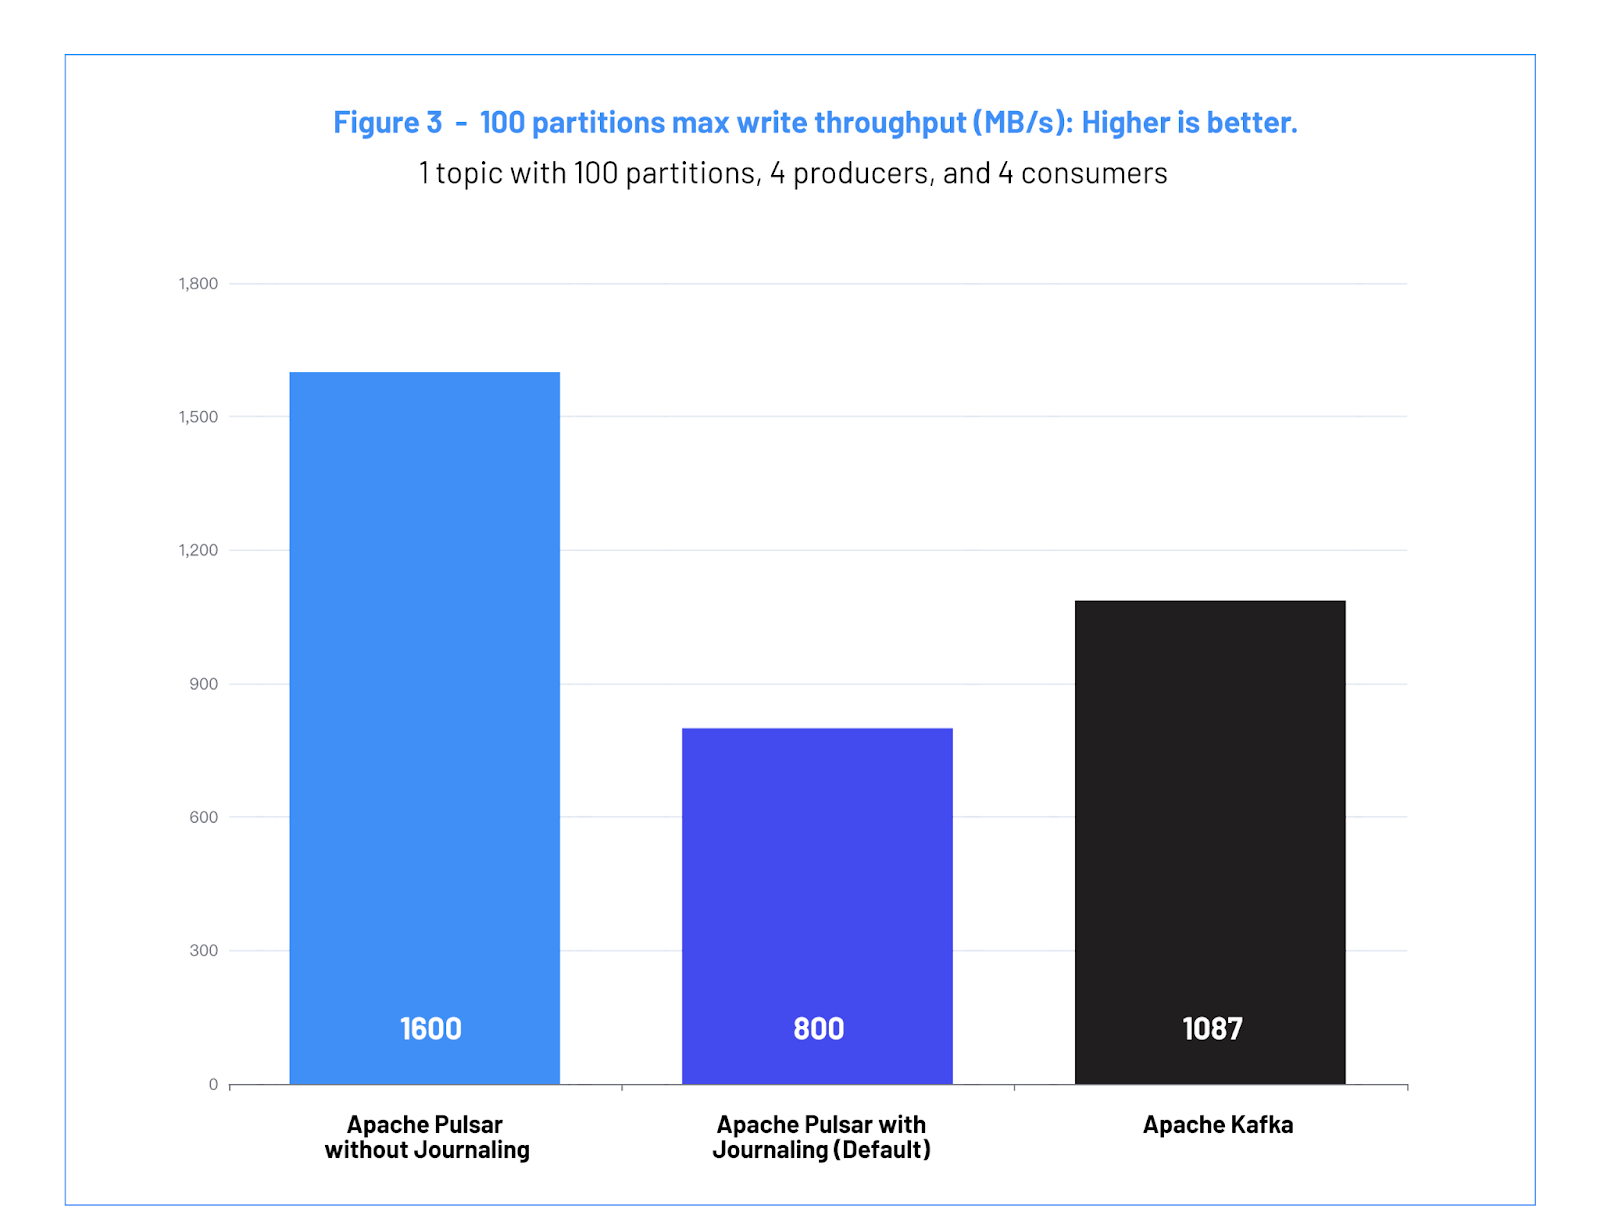
| 吞吐量 (MB/s) | 1600 | 800 | 1087 |
Figure 3: 100 partitions max write throughput (MB/s): Higher is better.
图 3: 100 分区的最大写入吞吐量 (MB/s): 数值越高,代表性能越好
b. Case #2 Analysis - 场景 #2 分析
Pulsar without Journaling achieves a throughput of 1600 (MB/s), Kafka achieves a throughput of 1087 (MB/s) and Pulsar with Journaling (Default) achieves a throughput of 800 (MB/s). At equivalent durability guarantees Pulsar is able to outperform Kafka in terms of maximum write throughput. The difference in performance stems from how Kafka implements access to the disk. Kafka stores data for each partition in different directories and files, resulting in more files open for writing and scattering the IO operations across the disk. This increases the stress and contention on the OS page caching system that Kafka relies on.
禁用 Journaling 情况下 Pulsar 取得了 1600(MB/s) 的吞吐量,Kafka 取得了 1087 (MB/s) 的吞吐量,而默认启用 Journaling 情况下 Pulsar 的吞吐量是 800 (MB/s) 。在同等持久性保证的情况下,Pulsar 在最大写入吞吐量方面能够胜过 Kafka。这个性能上的差异源于 Kafka 实现对磁盘的访问的方式。Kafka 将每个分区的数据存储在不同的目录和文件中,导致需要打开更多的文件用于写入,并将 IO 操作分散到各个磁盘。这增加了 Kafka 所依赖的操作系统页缓存的压力和争用。
When reading a file, the OS tries to cache blocks of data in the available system RAM. When the data is not available in the OS cache, the thread is blocked while the data is read from the disk and pulled in the cache.
读取文件时,操作系统尝试将数据块缓存到可用的系统 RAM 中。当数据在操作系统缓存中不可用时,则会从磁盘中读取数据并拉入缓存,此时线程会被阻塞。
The cost of pulling the blocked data into the cache is a significant delay (~100s of milliseconds) in serving write/read requests for other topics. This delay is observed in the benchmark results in the form of the publish latency experienced by the producers.
将阻塞数据拉入缓存的代价是在为其他主题处理写入/读取请求时会产生显著的延迟 (约 100 毫秒)。在基准测试结果中,这种延迟表现为生产者的发布延迟。
In the case of the default Pulsar deployment (with a journal for strong durability), the throughput is lower because 1 disk (out of 2 available in the VMs) is dedicated to the journal. Therefore we are capping the available IO bandwidth. In a production environment, this cap could be mitigated by having more disks to increase the IOPS/node capacity, but for this benchmark we used the same VM resources for each of the system configurations.
在 Pulsar 的默认部署下(启用 Journal 实现强持久性),吞吐量低于 Kafka,因为虚拟机中两块可用磁盘中的一个会专用于 Journal。因此可用 IO 带宽被限制了。在生产环境中,可以通过增加磁盘来增加每个节点的 IOPS 性能,从而缓解这个限制。但在本基准测试中,我们则为每个系统使用相同的虚拟机资源配置。
The difference in throughput can impact the cost of the solution. With parity of guarantees, this test shows that Pulsar would require 32% less hardware compared to Kafka for the same amount of traffic.
吞吐量的差异会影响解决方案的成本。我们的测试表明,在同等配置、同样的流量的情况下,Pulsar 比 Kafka 减少 32% 的硬件需求。
B. Test #2: Publish Latency - 测试 #2: 发布延迟
The purpose of this test is to measure the latency perceived by the producers at a steady state, with a fixed publish rate.
本测试的目的是测量生产者在稳定状态下以固定速率发布时所感知到的延迟。
Messaging systems are often used in applications where data must efficiently and reliably be moved from a producing application to be durably stored in the messaging system. In high volume scenarios, even momentary increases in latency can result in memory resources being exhausted. In other situations, a human user may be “in-the-loop” and waiting on an operation which publishes a message - for example, a web page needs the confirmation of the action before proceeding - and latency spikes can degrade the user experience. In these use cases, it is important to have a latency performance profile that is consistently within a given SLA (service-level agreement).
有些应用要求数据必须能从生产应用程序有效且可靠地移动到消息系统以便持久化存储起来,这也是消息系统的常见使用场景。在大容量前提下,即便只是延迟的瞬时增加也会导致内存资源耗尽。在其他情况下,桌面用户可能处于“循环中”,并等待发送消息的操作执行结束,例如一个网页需要等待确认才能继续下一步操作,而延迟的增加会损害用户体验。在这些场景中,将延迟性能稳定地保持在给定的 SLA(服务级别协议)之内是非常重要的。
It is also important to consider that a high latency in the long tail (eg: 99.9 percentile and above) will still have an outsized impact over an SLA that can be offered by an application. In practical terms, a higher 99.9% latency in the producer will often result in a significantly higher 99% latency for the application request.
同样重要的是要考虑到长尾高延迟(例如 99.9 百分位及以上的延迟)也会对应用可提供的 SLA 产生巨大影响。在实践中,更高的生产者 99.9% 延迟通常会导致应用程序请求的延迟明显高于 99.9% 。
Because the messaging bus sits at the bottom of the stack, it needs to provide a low and consistent latency profile so that applications can provide their own latency SLAs.This test is conducted by publishing and consuming at a fixed rate of 500 MB/s and comparing it to the publish latency seen by producers.
由于消息总线是底层技术栈组件,所以它需要提供稳定的低延迟,这样应用程序才好提供自己的延迟 SLA。本测试以 500 MB/s 的固定速率发布和消费消息,然后比较生产者观测到的发布延迟。
驱动文件:pulsar.yaml, kafka-latency.yaml
负载文件:1-topic-100-partitions-1kb-4p-4c-500k.yaml
a. Test #2 Results: Publish Latency - 测试 #2 结果: 发布延迟
| 禁用 Journaling 情况下的 Apache Pulsar | 启用 Journaling 情况下的 Apache Pulsar (默认) | Apache Kafka | |
|---|---|---|---|
| P50 (ms) | 0.77 | 2.64 | 1.75 |
| P75 (ms) | 0.85 | 2.86 | 2.09 |
| P95 (ms) | 1.36 | 4.62 | 2.86 |
| P99 (ms) | 1.58 | 7.89 | 3.46 |
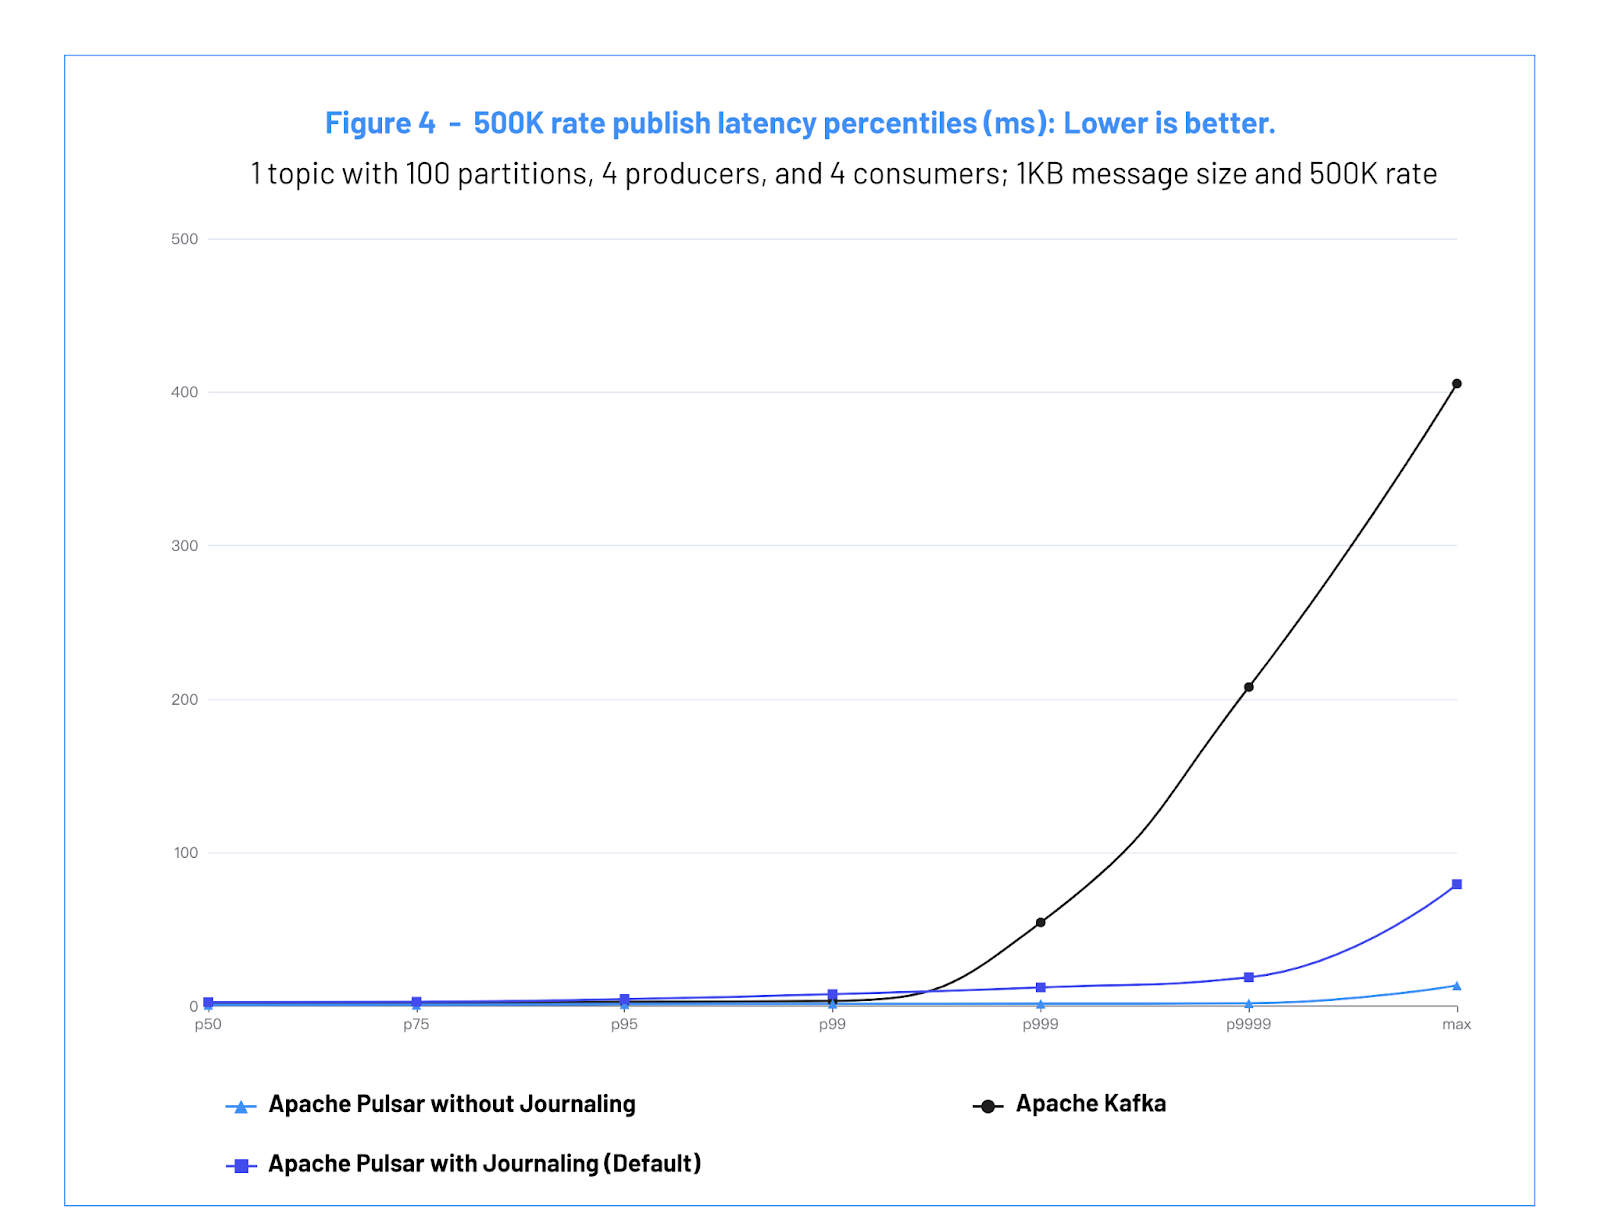
| P99.9 (ms) | 1.68 | 12.24 | 54.56 |
| P99.99 (ms) | 1.96 | 18.82 | 207.83 |
| Max | 13.52 | 79.40 | 405.48 |
Figure 4: 500K rate publish latency percentiles (ms): Lower is better.
图 4:500K 速率的发布延迟百分位 (毫秒):数值越低,代表性能越好
b. Test #2 Analysis测试 #2 分析
In this test, Pulsar is able to maintain a low publish latency while sustaining a high per-node utilization. Pulsar without Journaling is able to sustain 1.58 milliseconds latency at the 99 percentile and Pulsar with Journaling is able to sustain 7.89 milliseconds.
在本测试中,Pulsar 能够在保持较高节点利用率的同时保持较低的发布延迟。禁用 Journaling 情况下 Pulsar 能够维持 1.58 毫秒的 99 百分位延迟,而启用 Journaling 情况下 Pulsar 能够维持在 7.89 毫秒。
Kafka maintains a low publish latency up to the 99 percentile, where it is able to sustain 3.46 milliseconds in latency. But at 99.9%, Kafka’s latency spikes to 54.56 ms.
Kafka 在 99 百分位之内可以保持低发布延迟,最高延迟为 3.46 毫秒。然而当 99.9% 时,Kafka 的延迟飙升至 54.56 毫秒。
Publishing at a fixed rate, below the max burst throughput, at 99.9% and above, Pulsar has lower latency than Kafka for both Pulsar with Journaling (default) and the Pulsar without Journaling.
在以固定速率发布的情况下,在最大突发吞吐量以下,在 99.9% 及以上时,Pulsar 的延迟都比 Kafka 更低,无论是否启用 Journaling。
The reasons for lower latency with Pulsar are:
Pulsar 能做到更低延迟的原因在于:
- When running Pulsar without Journaling, the critical data write path is decoupled from the disk access so it is not susceptible to the noise introduced by IO operations. The data is guaranteed to only be copied in memory, (unlike OS page cache which blocks under high load situations,) and then is flushed by background threads. 在禁用 Journaling 情况下运行 Pulsar 时,关键数据写入路径与磁盘访问是解耦的,因此不易受 IO 操作带来的干扰的影响。数据仅保证被复制到内存(而操作系统页缓存在高负载情况下会被阻塞),然后再被后台线程刷到磁盘。
- Pulsar with Journaling (Default) is able to maintain low latency because the BookKeeper replication protocol is able to ignore the slowest responding storage node. Due to the internal disk garbage collection mechanism, the performance profile of SSD and NVMe disks is characterized by good average write latency but with periodic latency spikes of up to 100 milliseconds. BookKeeper is able to smooth out the latency when used in 3/3/2 configuration, because it only waits for the two fast storage nodes for each entry. Pulsar 在默认情况下启用 Journaling 情况下也能保持低延迟,这是因为 BookKeeper 复制协议能够忽略响应最慢的存储节点。由于内部磁盘垃圾收集机制,SSD 和 NVMe 磁盘的性能配置文件具有良好的平均写入延迟,但会有高达 100 毫秒的周期性的延迟峰值。BookKeeper 在使用 3/3/2 配置时能够平滑延迟,因为对每个 Entry 只需等待最快的两个存储节点响应即可。
By contrast, Kafka replication protocol is set to wait for all three of the brokers that are in the in-replica-set. Because of that, unless a broker crashes or is falling behind the leader for more than 30 seconds, each entry in Kafka needs to wait for all three brokers to have the entry.
相比之下,Kafka 复制协议要等待同步副本集合中的所有三个 Broker 返回。因此,除非 Broker 崩溃或者落后于 Leader 30 秒以上,否则 Kafka 中每个 Entry 都需要等待写入所有三个 Broker。
C. Test #3: Catch-up Reads测试 #3: 追赶读(Catch-up Read)
In the consumer catch-up test, we build a backlog of data and then start the consumers. While the consumers catch-up, the writers continue publishing data at the same rate.
在消费者 catch-up 测试中,我们先构造数据积压,再启动消费者。在消费者 catch-up 的同时,生产者继续以同样的速率发布数据。
This is a common, real-life scenario for a messaging/streaming system. Below are a few common use cases:
这是消息/流系统的一个常见的真实设定。以下是一些常见的场景:
- Consumers come back online after a few hours of downtime and try to catch-up. 消费者在宕机若干小时候重新上线,并尝试追赶数据。
- New consumers get bootstrapped and replay the data in the topic. 新的消费者被启动,并重放主题中的数据。
- Periodic batch jobs that scan and process the historical data stored in the topic. 周期性的批处理任务扫描并处理主题中存储的历史数据。
With this test, we can measure the following:
本测试可以测量如下内容:
- The catch-up speed.
Catch-up 速度。
- Consuming applications want to be able to recover as fast as possible, draining all the pending backlog and catching up with the producers in the shortest time. 消费应用希望能尽快恢复,在最短时间内耗尽待处理的 Backlog 并追赶上生产者。
- The ability to avoid performance degradation and isolate workloads.
避免性能下降以及隔离负载的能力。
- Producing applications need to be decoupled and isolated from consuming applications and also from different, unrelated topics in the same cluster. 生产应用需要与消费应用以及同一集群中的不同的、不相关的主题解耦并隔离。
The size of the backlog is 512 GBs. It is larger than the RAM available in the nodes in order to simulate the case where the entire data does not fit in cache and the storage systems are forced to read from disk.
Backlog 的大小为 512 GB,这比节点中的可用 RAM 要大,以便模拟整个数据不适合缓存并迫使存储系统从磁盘读取的情况。
驱动文件:pulsar.yaml, kafka-latency.yaml
负载文件:1-topic-100-partitions-1kb-4p-4c-200k-backlog.yaml
a. Test #3 Results: Catch-up Reads - 测试 #3 结果: 追赶读(Catch-up Read)
| 禁用 Journaling 情况下的 Apache Pulsar | 启用 Journaling 情况下的 Apache Pulsar (默认) | Apache Kafka | |
|---|---|---|---|
| 最大读取吞吐量 (GB/s) | 3.2GB/s | 3.1GB/s | 2GB/s |
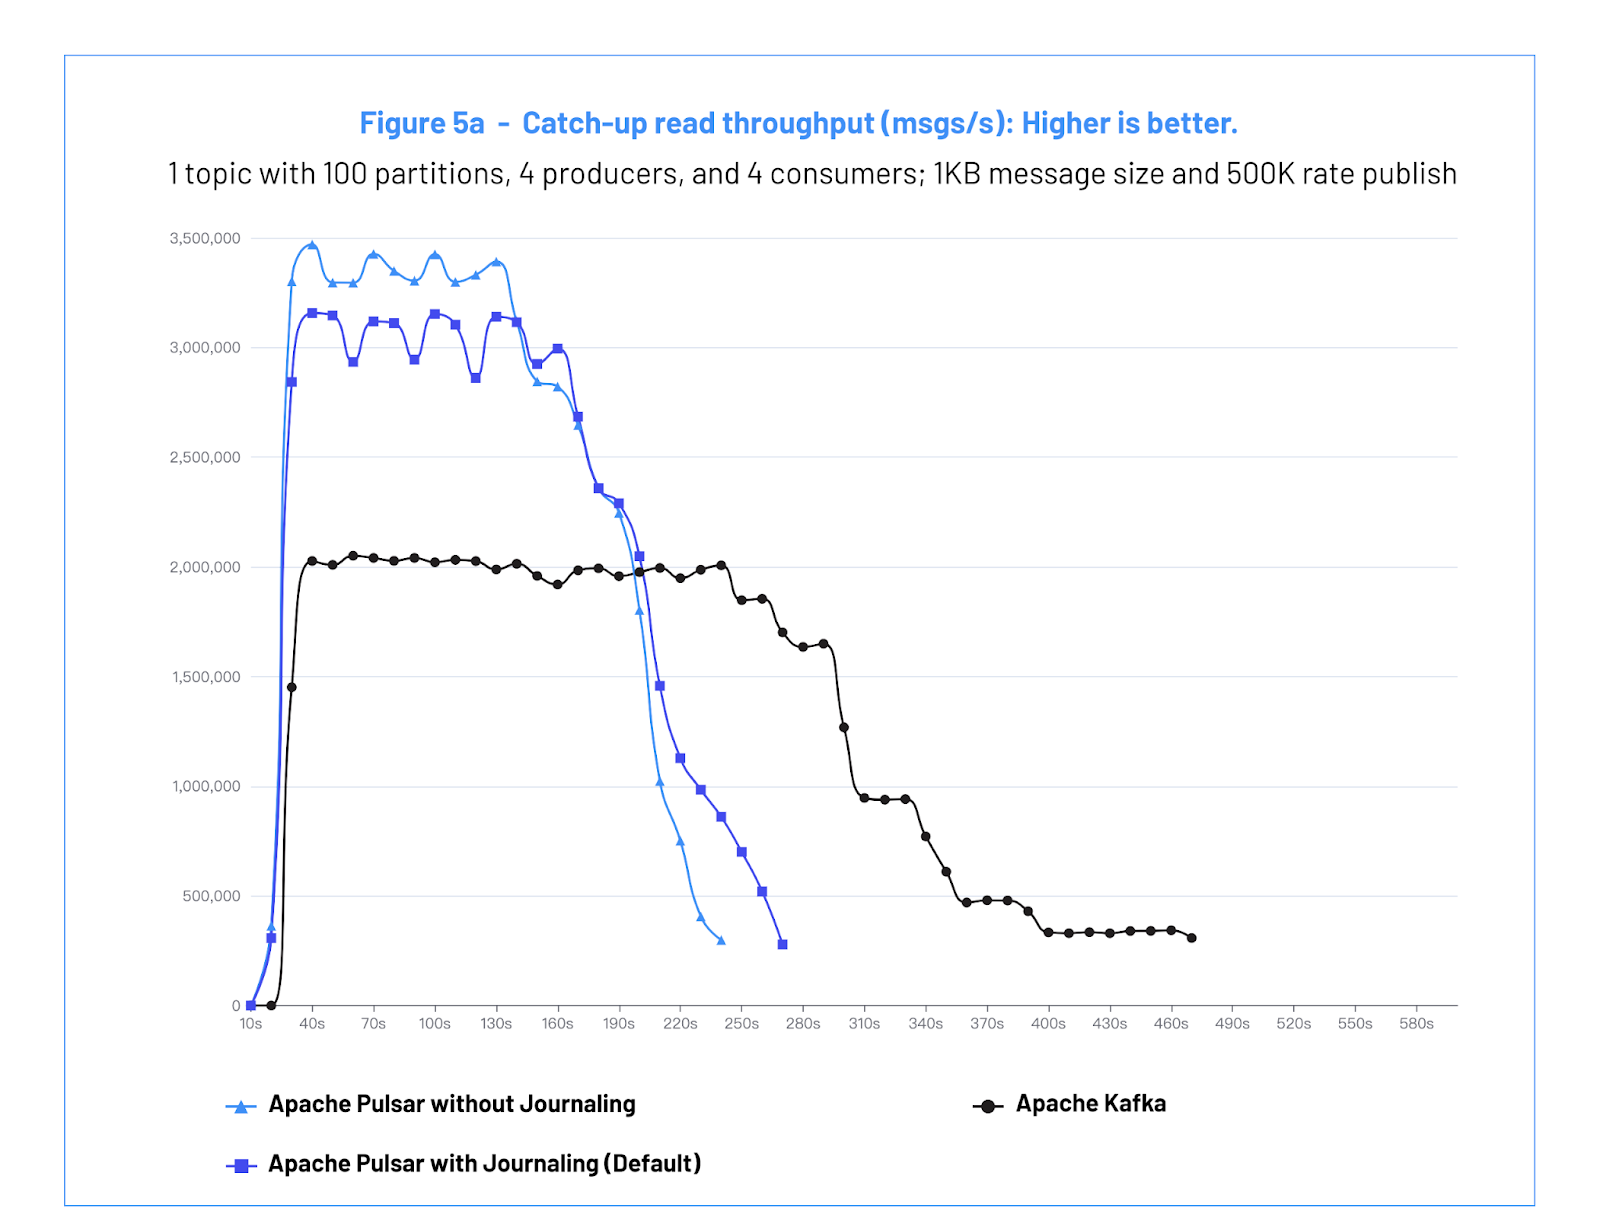
Figure 5a: Catch-up read throughput (msgs/s): Higher is better.
图 5a:追赶读的吞吐量 (msgs/s):数值越高,代表性能越好。

| 禁用 Journaling 情况下的 Apache Pulsar | 启用 Journaling 情况下的 Apache Pulsar (默认) | Apache Kafka | |
|---|---|---|---|
| 追赶时间 (s) | 230 | 260 | 460 |
Figure 5b: Catch-up read chase time (seconds): Shorter is better.
图 5b:追赶读取时间 (秒):数值越短,代表性能越好。
| 禁用 Journaling 情况下的 Apache Pulsar | 启用 Journaling 情况下的 Apache Pulsar (默认) | Apache Kafka | |
|---|---|---|---|
| P99 发布延迟 (毫秒) | 最高可达 2.5 | 最高可达 21 | 最高可达 380 |
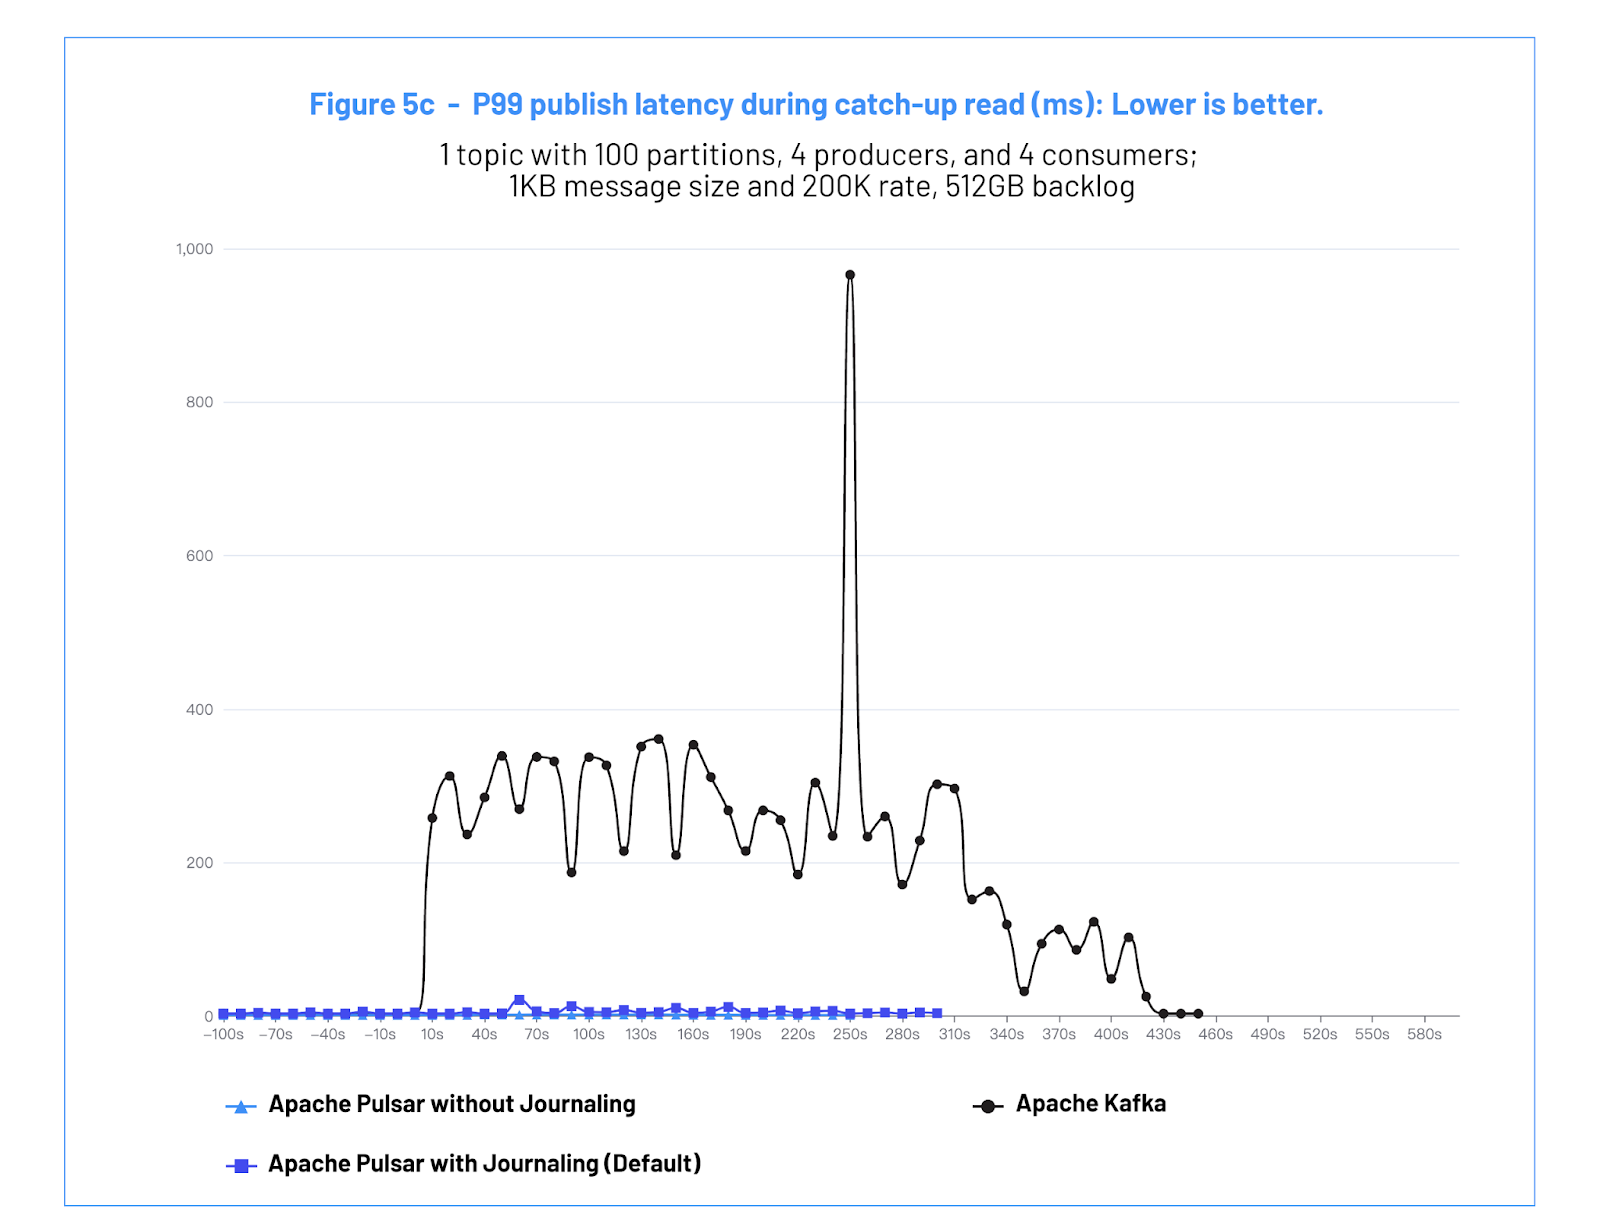
Figure 5c: Impact publish latency during catchup read (ms): Lower is better.
图 5c:追赶读期间对发布延迟的影响 (毫秒):数值越低,代表越好。
b. Test #3 Analysis - 测试 #3 分析
The test shows that Pulsar consumers are able to drain the backlog of data ~2.5x faster than Kafka consumers, without impacting the performance of the connected producers.
测试表明 Pulsar 消费者能够比 Kafka 消费者快约 2.5 倍耗尽 Backlog,而不会影响相关生产者的性能。
With Kafka, the test showed that while the consumers are catching up, the producers are heavily impacted, with 99% latencies up to ~700 milliseconds and consequent throughput reductions.
而对于 Kafka,测试表明当消费者赶上时,生产者受到了严重影响,其 99% 延迟高达约 700 毫秒,吞吐量也因此降低。
The increase in latency is caused by the contention on the OS page cache used by Kafka. When the size of the backlog of data exceeds the RAM available in the Kafka broker, the OS will start to evict pages from the cache. This causes page cache misses that stop the Kafka threads. When there are enough producers and consumers in a broker, it becomes easy to end up in a “cache-thrashing” scenario, where time is spent paging data in from the disk and evicting it from the cache soon after.
这种延迟的增加是由于 Kafka 所使用的操作系统页缓存的争用引起的。当 Backlog 大小超过 Kafka Broker 中的可用 RAM 时,操作系统会从缓存中逐出页。这会导致页缓存未命中,从而停止 Kafka 线程。当 Broker 中有足够多的生产者和消费者时,就会很容易陷入“缓存抖动”场景,时间就会花在从磁盘中缓存数据而很快又将其从缓存中逐出。
In contrast, Pulsar with BookKeeper adopts a more sophisticated approach to write and read operations. Pulsar does not rely on the OS page cache because BookKeeper has its own set of write and read caches, for which the eviction and pre-fetching are specifically designed for streaming storage use cases.
相比之下,Pulsar 底层的 BookKeeper 采用更巧妙的方式来执行写入和读取操作。Pulsar 并不依赖操作系统页缓存,因为 BookKeeper 有自己的一组写入和读取缓存,其逐出和预读都是专门为流式存储场景特别设计的。
This test demonstrates the degradation that consumers can cause in a Kafka cluster. This impacts the performance of the Kafka cluster and can lead to reliability problems.
测试表明在 Kafka 集群中消费者可能导致降级。这会影响 Kafka 集群的性能,并可能导致可靠性问题。
Conclusion - 总结
The benchmark demonstrates Apache Pulsar’s ability to provide high performance across a broad range of use cases. In particular, Pulsar provides better and more predictable performance, even for the use cases that are generally associated with Kafka, such as large volume streaming data over partitioned topics. Key highlights on the Pulsar versus Kafka performance comparison include:
本次基准测试展示了在广泛的测试场景中 Apache Pulsar 均有能力提供高性能。特别是,即使面对通常与 Kafka 相关的场景,例如分区主题上的大量流数据,Pulsar 也能提供更高和更可预测的性能。Pulsar 与 Kafka 性能对比的主要亮点包括:
Pulsar provides 99pct write latency <1.6ms without journal, and <8ms with journal for fixed 500MB/s write throughput. The latency profile does not degrade at the higher quantiles, while Kafka latency quickly spikes up to 100s of milliseconds. 在固定 500MB/s 的写入吞吐量情况下,Pulsar 在禁用 Journal 情况下提供 <1.6ms 的 99 百分位写入延迟,在启用 Journal 情况下则为 <8ms。在高百分位下,Pulsar 的延迟也仅轻微增加没有降级,而 Kafka 的延迟则快速飙升至 100 毫秒。
Pulsar can prove up to 3.2 GB/s historical data read throughput, 60% more than Kafka which can only achieve 2.0 GB/s. Pulsar 可以达到高达 3.2 GB/s 的历史数据读取吞吐量,比只能达到 2.0 GB/s 的 Kafka 高出 60%。
During historical data reading, Pulsar’s I/O isolation provides a low and consistent publish latency, 2 orders of magnitude lower than Kafka. This ensures that the real-time data stream will not be affected when reading historical data. 在历史数据读取过程中,Pulsar 的 I/O 隔离特性提供了稳定的低发布延迟,比 Kafka 低 2 个数量级。这保证了在读取历史数据时实时数据流不受影响。
Pulsar: Unified Messaging & Streaming, and the Future - Pulsar:统一的消息 & 流处理系统,及其未来
While Pulsar is often adopted for streaming use cases, it also provides a superset of features and is widely adopted for message queuing use cases and for use cases that require unified messaging and streaming capabilities. This benchmark did not cover the message queuing capabilities of Pulsar, but you can learn more in the Pulsar Launches 2.8.0, Unified Messaging and Streaming blog.
虽然 Pulsar 常被用于流处理场景,但它同时还提供了许多其他特性并广泛用于消息队列场景,以及需要统一的消息和流处理能力的场景。本基准测试并未涵盖 Pulsar 的消息队列功能,但您可以在Pulsar 2.8.0 新增特性概览:独占 Producer、事务等、Apache Pulsar 里程碑简史:打造统一消息流平台与生态中了解更多。
Beyond the development of Pulsar’s capabilities, the Pulsar ecosystem continues to expand. Protocol handlers allow for Pulsar brokers to natively communicate via other protocols, such as Kafka and RabbitMQ, enabling teams to easily integrate existing applications with Pulsar. Integrations with Apache Pinot, Delta Lake, Apache Spark, and Apache Flink have allowed teams to make Pulsar the ideal choice to help teams use one technology across both the data and application tiers.
除了对功能的开发,Pulsar 的生态系统也在不断壮大。协议处理器允许 Pulsar Broker 与 Kafka 和 RabbitMQ 等其他协议天然地进行通信,使得团队能够轻松地将现有应用与 Pulsar 集成。与 Apache Pinot、Delta Lake、Apache Spark 和 Apache Flink 的集成使得 Pulsar 成为团队跨数据层和应用层的一站式技术的理想选择。
For more on Pulsar, check out the resources below.
有关 Pulsar 的更多信息,请查看以下资源。
Want to Learn More? - 想了解更多?
- To learn more about Apache Pulsar use cases, check out this page. 要了解更多 Apache Pulsar 用户案例,请查看此页面。
- Sign up for the monthly StreamNative Newsletter for Apache Pulsar. 订阅月度 StreamNative Newsletter for Apache Pulsar。
References - 参考资料
[1] Linux Foundation Open Messaging 基准测试套件: http://openmessaging.cloud/docs/benchmarks/
[2] Open Messaging Benchmark Github 代码库: https://github.com/openmessaging/benchmark
[3] 更准确地了解 Pulsar 性能:https://streamnative.io/blog/tech/2020-11-09-benchmark-pulsar-kafka-performance/